Loading DLD Database...

Please wait while the database and visualizations are prepared.

Total Regions

Unique Proteins

Total PDB Chains

Independent Domain Linkers (IDL)
Dependent Domain Linkers (DDL)
DisProt Linkers
Termini
N-termini
C-termini
Filtered Dataset (Click a row to select)
Loading structure viewer...

The 3D structure and sequence track are being prepared. This can take a few seconds.

3D Structure Viewer (AlphaFold & PDBs)
1D Sequence & Feature Viewer
Viewer Commands
Region details
How to Use
Navigation

The app is organized in four tabs:

  • Main tab: Browse and filter proteins in the dataset. Select a protein and a region to explore.
  • Viewer tab: Visualize the selected protein in 3D and explore its sequence features interactively.
  • Help tab: Usage instructions, contact information, and data downloads.
  • About tab: Dataset construction details, app information, and citation.

3D Structure Viewer

The 3D viewer displays AlphaFold models and experimental PDB structures for the selected protein.

  • Use the Viewer Commands panel to toggle individual models on/off.
  • Click on a region or PFAM domain in the sequence track to highlight it in the 3D structure.
  • The highlighted region will be colored according to its track color.
  • Use the mouse to rotate (left click + drag), zoom (scroll), and pan (right click + drag) the structure.

1D Sequence & Feature Viewer

The sequence track displays the following layers from bottom to top:

  • Sequence: Each amino acid is shown as a single letter at its UniProt position.
  • pLDDT: AlphaFold per-residue confidence score, colored by the official AF colorscale:
    • Very High (>90)
    • High (70–90)
    • Low (50–70)
    • Very Low (<50)
  • Regions (per PDB chain): Structural regions annotated per chain, color coded by type:
    • Domain
    • IDL — Independent Domain Linker
    • DDL — Dependent Domain Linker
    • Loops
  • Disprot Linkers: DisProt-annotated linker regions, shown in dark red , one track per region.
  • PFAM Domains: Pfam domain annotations, one color per domain name.

Interactivity
  • Click any region, Disprot linker, or PFAM domain in the track to highlight it in the 3D viewer and display its details in the Region Details panel.
  • Hover over any element in the track to see a tooltip with coordinates and identifiers.
  • Use the plotly toolbar (top right of the track) to zoom, pan, or reset the view .
Parameter definition
Parameter Definition Source
FCR Fraction of charged residues, between 0 and 1. FCR = f+ + f- localCIDER
NCPR Net charge per residue, between -1 and 1. NCPR = f+ - f- localCIDER
Fraction of positive residues ( F+ ) F+ = F[K] + F[R] localCIDER
Fraction of negative residues ( F- ) F- = F[D] + F[E] localCIDER
Fraction of polar residues F[S] + F[T] + F[N] + F[Q] + F[H] + F[G] localCIDER
Fraction of proline residues F[P] localCIDER
Fraction of aliphatic residues F[I] + F[L] + F[V] + F[M] localCIDER
Fraction of aromatic residues F[F] + F[Y] + F[W] localCIDER
Fraction of expansion promoting residues F[E] + F[D] + F[R] + F[K] + F[P] localCIDER
Fraction of disorder promoting residues F[T] + F[A] + F[G] + F[R] + F[D] + F[H] + F[Q] + F[K] + F[S] + F[E] + F[P] localCIDER
Hydrophobicity Mean hydrophobicity scaled from 0 to 9, calculated from the Kyte-Doolittle hydrophobicity scale. SPARROW
SCD Interpret with caution Sequence charge decoration; captures the linear distribution of charged residues. SPARROW
SHD Interpret with caution Sequence hydropathy decoration; captures the linear distribution of hydrophobicity. SPARROW
Omega Interpret with caution Patterning between charged/proline residues and all other residues. A value of -1 means that the parameter cannot be calculated because of sequence composition. localCIDER
Kappa Interpret with caution Patterning between positive and negative charged residues. A value of -1 means that the parameter cannot be calculated because of sequence composition. SPARROW
End_to_end_distance Predicted average distance between the termini in the ensemble. This is the scaled end-to-end distance. SPARROW
Radius_of_gyration_scaled Predicted average distance to the center of mass of the ensemble. This is the scaled radius of gyration. SPARROW
Asphericity Predicted deviation from a perfect, symmetrical ensemble. SPARROW
Predicted Prefactor (rho0) and scaling exponent (nu) Polymer laws: Rg = rho0 * N^nu . The prefactor depends on the details of the monomer and bond geometry. The scaling exponent depends on the dimensions of the chain, with a value of 3/5 for the expanded coil state. SPARROW
Missing Percentage and Missing length Missing residues in the PDB-chain. Experimental
These parameters describe sequence patterning and are sensitive to length and composition. Direct comparison across non-homologous sequences is not recommended without controlling for sequence length, charge fraction, and residue content.
Download Data

Download the full dataset files below. These files contain the complete data used to build this database, independent of any filter applied in the app.

Raw Data Files
Data with Details
Contact Us

For questions, bug reports, or feedback about the database or the app, please reach out to us at:

The DLD-Dataset was used for developing a predictor. Visit the web page!

Visit our other tool for analysis of flexible linkers.

About this app (Version 1.0a)

The DLD-Dataset Viewer is a platform-independent browser-based interface that facilitates the visualization of flexible linker properties and dataset exploration

The DLD-Dataset Viewer was developed by the @ChemesLab. The application is based on the Shiny package and it was coded by Juliana Glavina, PhD, with server implementation by Cesar Leonetti.

This app only records protein consultations, dataset downloads, and clicks to LinkerPred or CeffApp Calculator.

Dataset Construction

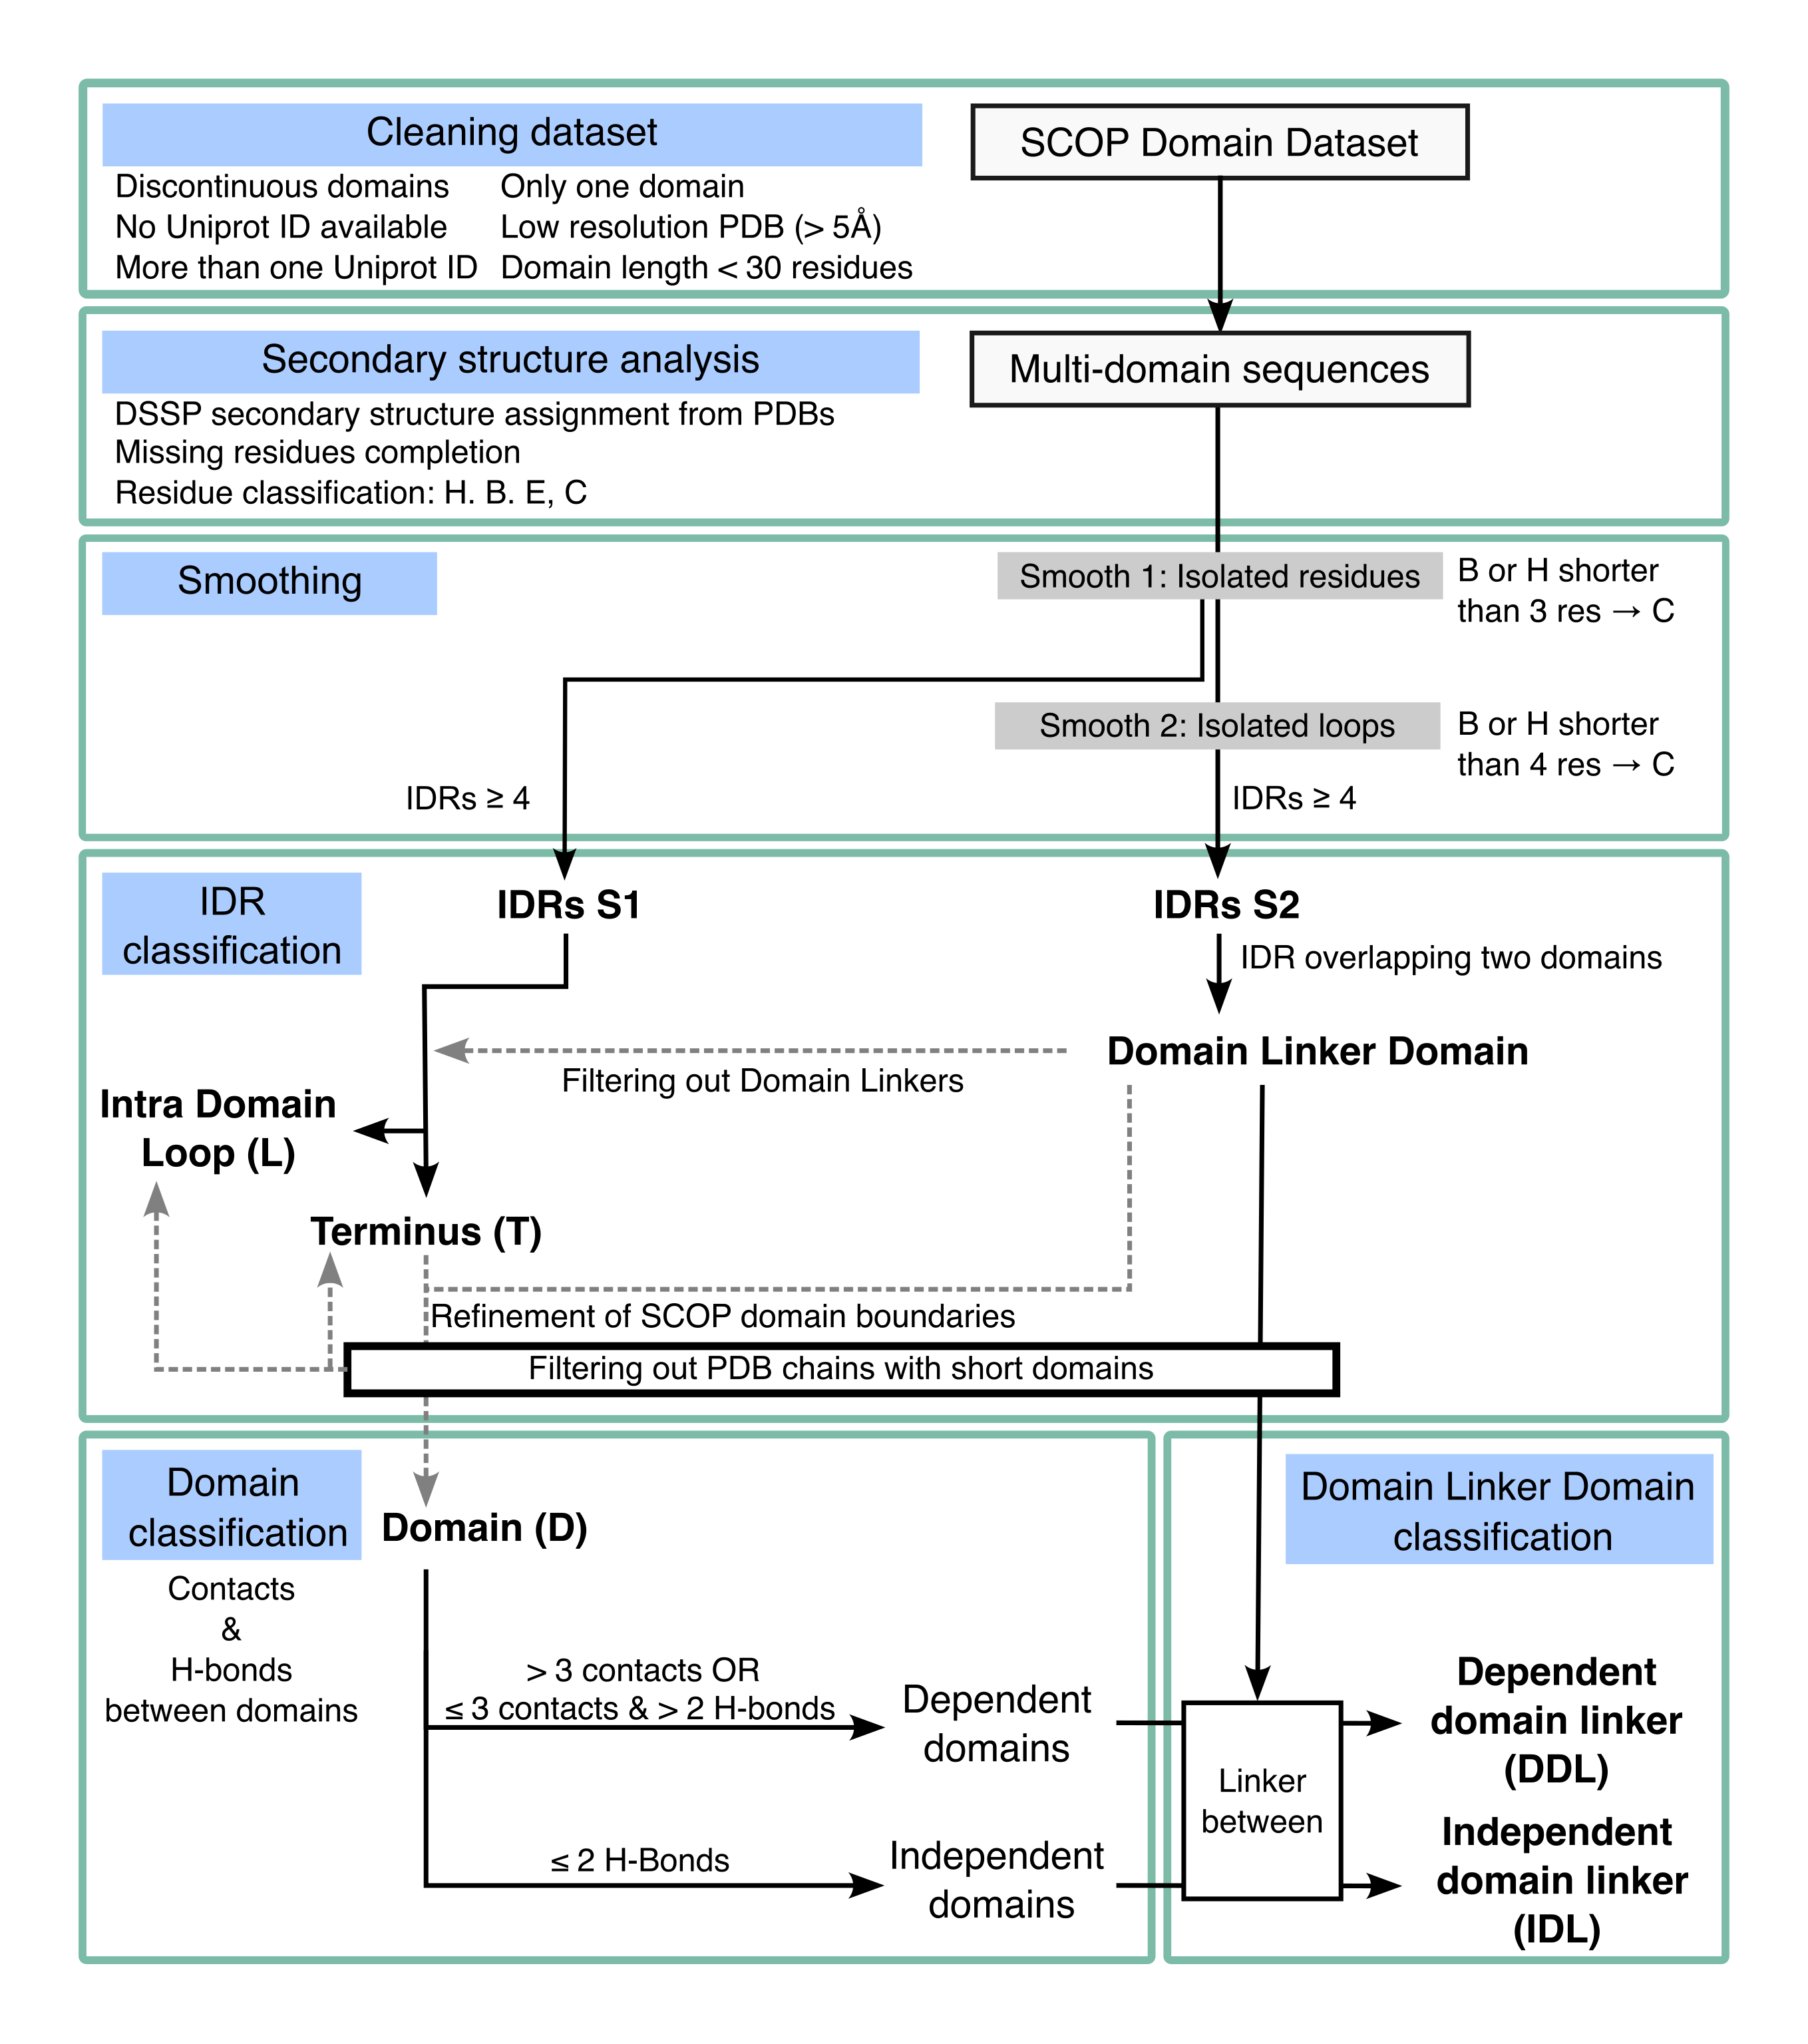
The DLD dataset identifies Independent Domain Linkers (IDLs) by extracting high-quality domain annotations from SCOP2, filtering for multi-domain proteins, and refining linker regions using DSSP-based secondary structure analysis.

A two-step smoothing process helps distinguish 1,640 IDLs and 647 Dependent Domain Linkers (DDLs), alongside other protein regions. The dataset is mapped to UniProt, providing a comprehensive resource for studying disordered flexible linkers and enhancing computational predictions.

Dataset construction workflow
Please Cite Us

Expanding the Landscape of Disordered Flexible Linkers: A Structural and Computational Framework for DLD dataset assembly

Di Meng*, Juliana Glavina*, Heli M. García Álvarez, Cesar O. Leonetti, Gianluca Pollastri and Lucía Beatriz Chemes

Submitted · bioRxiv preprint

* Equal contribution